![[weather icon]](weather.gif)
![[weather icon]](weather.gif) |
Observing Constraints - Sky Background |
The sky background is presented separately for Mauna Kea and Cerro Pachon.
The Mauna Kea sky background is described here for the following wavelength regimes:
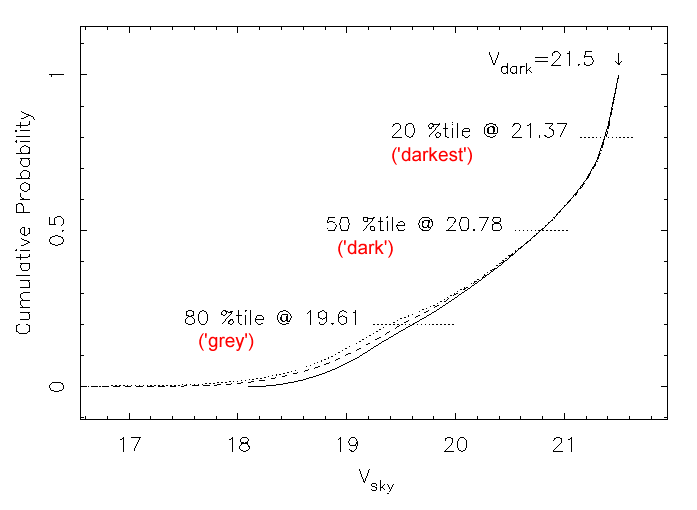
The optical sky background depends on a number of parameters including the target - moon angular separation, lunar phase, ecliptic latitude, zenith angle, and phase of the solar cycle (e.g. Krisciunas 1997, PASP, 209, 1181; Krisciunas and Schaefer 1991, PASP, 103, 1033; Benn and Ellison 1998, La Palma Technical Note 115). A model was constructed following the prescription of Krisciunas (1997) and Krisciunas and Schaefer (1991). The graph below shows the cumulative probability distributions of V-band sky brightness at an arbitrary phase in the solar cycle for three model observation scenarios. In the first model the target is always at the zenith. The second and third models are more realistic Monte Carlo realisations of likely queue and classical programs. In the second model targets were chosen with a gaussian distribution in Hour Angle with sigma=1 hour, and with a distribution in Declination between -20 and +90 degrees based on the surface area of the celestial sphere. The third model is the same as the second, but with the further constraint that the target must be at least 30 degrees from the moon. It may seem surprising that the results of these 3 models differ so little. This is due to the fact that the primary dependence of night sky brightness is on lunar phase, and secondarily on moon - target distance.
The results of these calculations indicate that the sky at Mauna Kea is fainter than 20.78 mag/arcsec2 for 50% of the time and fainter than 21.37 mag/arcsec2 for 20% of the time for any random target. (For an unbiased distribution of queue-mode nights the moon is below the horizon for about half the time, of course).

The values presented in the observing constraints table, and used in the integration time calculator, are valid for semesters 2000B - 2001B and have been adjusted from the graph above to those expected for a nominal solar cycle variation (currently close to the mid-point). These values will be modified slightly each year or so.
The colour of the sky changes with lunar phase. Adopted values are shown in the table below (taken from ESO, by scaling V for inferred equivalent lunar phase, and from Walker, NOAO Newsletter No. 10). The conversion between the sky background category and the number of nights from new moon indicates the constraints that are applied to schedule classical observations and do not necessarily correspond to conventional definitions of dark, grey and bright time.
| Sky Background Category | Approx Nights From New Moon (+/-) | Sky Brightness (mag/arcsec2) | |||
| V-band | U-band | B-band | R-band | ||
| 20%-ile ('darkest') |
=< 3 | 21.3 | V + 0.0 | V + 0.8 | V - 0.9 |
| 50%-ile ('dark') |
=< 7 | 20.7 | V - 1.5 | V + 0.2 | V - 0.8 |
| 80%-ile ('grey') |
=< 11 | 19.5 | V - 2.2 | V - 0.0 | V - 0.4 |
| any ('bright') |
=< 14 | 18.0 | V - 3.0 | V - 0.5 | V - 0.1 |
A description of how this table is used by the scheduler to select queue-mode observations for execution is yet to be added. Note that the V-band sky is brighter at low ecliptic latitude by ~0.4 mag (Benn and Ellison 1998. La Palma Technical Note 115).
Data from HM Nautical Almanac Office, showing sun and moon rising and setting times and lunar phases for Mauna Kea and Cerro Pachon/Tololo, are available at (just substitute the year you want in the URL to get other years):
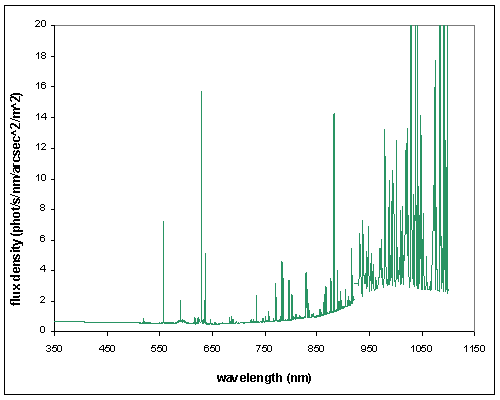
The broad-band sky brightnesses given in the table above have been used to scaled a model optical sky spectrum . These spectra are used in the Integration Time Calulator. The sky spectrum is patched to the near-IR sky spectrum at a wavelength of 920nm. An example is shown below (for 50%, 'dark' conditions) and the data file is available.

The near-IR (1-2.5Ám) sky background is dominated by many intrinsically narrow hydroxyl (OH) emission lines. A few other species (e.g. molecular oxygen at 1.27Ám) also contribute, as do H2O lines at the long wavelength end of the K window. During the night the hydroxyl lines vary in brightness on a timescale of 5-15 minutes and with an amplitude of 5-10% as atmospheric wave phenomena change the local density of species. As the emission occurs via a radiative cascade, all of the lines vary together in brightness to first order.
The strength of the OH lines also exhibits a steady decline for the first 1-2 hrs after sunset. Spectroscopic observations at low and intermediate resolutions are usually not advisable during twilight, especially in the J and H bands, as it can be difficult to achieve accurate sky subtraction. Imaging observations of bright objects are possible however, albeit with an increased and varying background.
The Integration Time Calculators employ model sky emission spectra, an example of which is shown below. In addition to the OH lines, the model incorporates zodiacal emission (approximated by a 5800K black body), thermal emission from the atmosphere (treated as a 250K black body scaled by 1 - transmission), and an "average" amount of moonlight. Note that moonlight can be the dominant background source (e.g., much more so than in the model spectra), especially in the J band when the moon is bright and especially when the target is close to the moon.

A typical very large data file of the sky background spectrum at high resolution from 0.9 to 5.6 microns, used in the ITCs, is available.
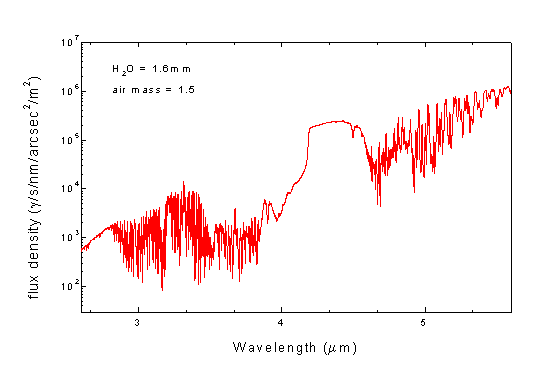
The near-IR (3-5Ám) sky background is due primarily to thermal emission from the atmosphere i.e. it is equivalent to (1 - transmission) multiplied by a blackbody spectrum at a temperature of about 250K. The transmission (and therefore the emission) varies with atmospheric water vapour content and air mass. See the descriptions of atmospheric transmission and the adopted water vapour conditions for more information. An example model background spectrum, smoothed to a resolution of 2cm-1, is shown below.

A typical very large data file of the sky background spectrum at high resolution, used in the ITCs, is available.
The mid-IR (7-25Ám) sky background behaves similarly to the 3-5Ám background, but is much more intense. A typical very large data file of the sky background spectrum at high resolution, used in the MICHELLE ITCs, is available.
The sky background has been modeled for Cerro Pachon as well and is used in its ITCs. Data files are similar to those for Mauna Kea.
Last update January 17, 2007; Tom Geballe
In original form December 12, 1999; Phil Puxley, Ted von Hippel and Tom Geballe