![[weather icon]](weather.gif)
| |
Transmission Spectra |
Spectra of the atmospheric transmission above Mauna Kea were generated using the ATRAN modelling software (Lord, S.D. 1992, NASA Technical Memor. 103957) and are presented separately for the near-IR and mid-IR.
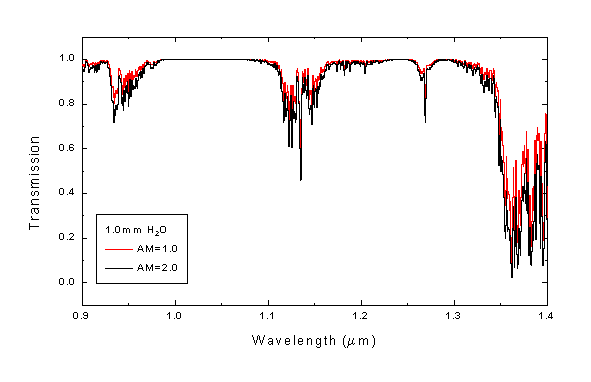
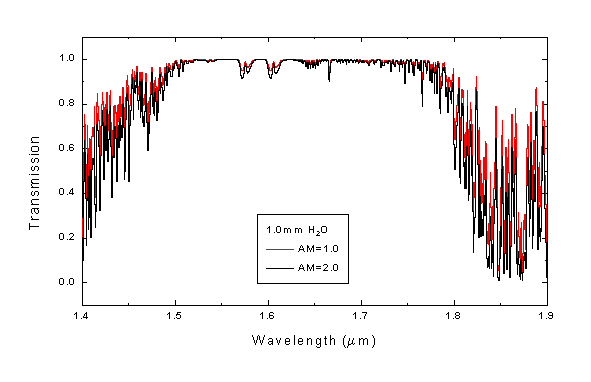
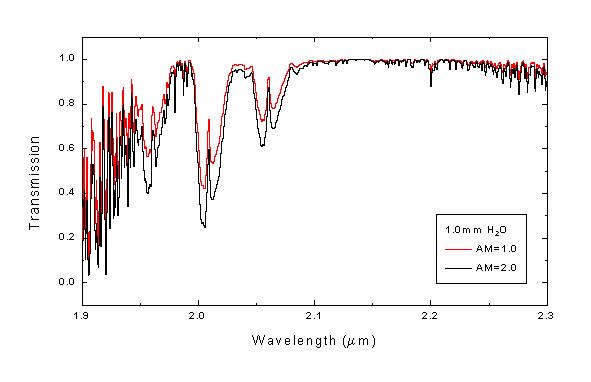
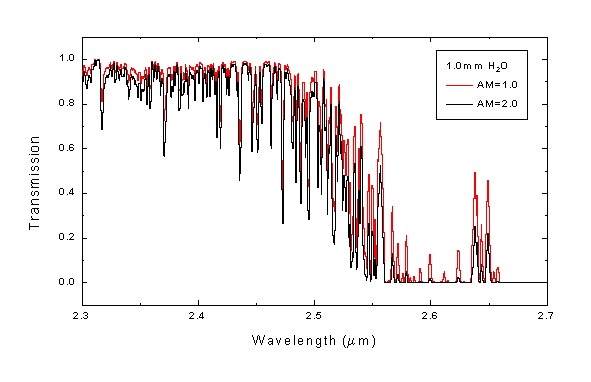
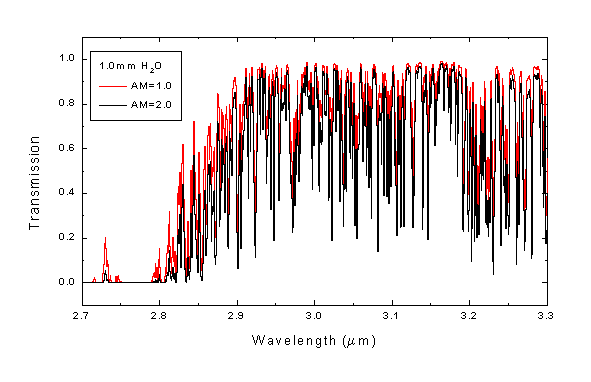
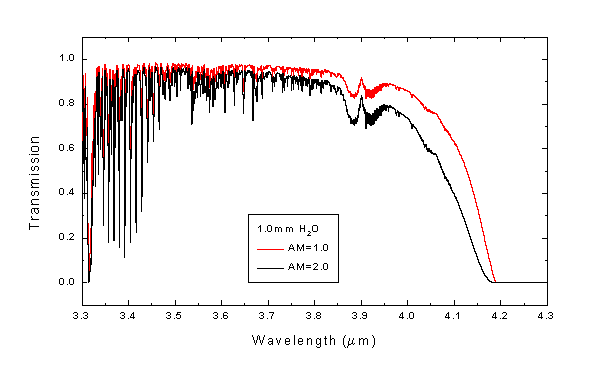
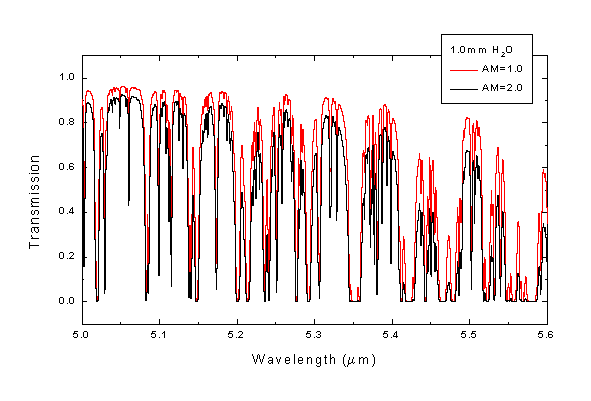
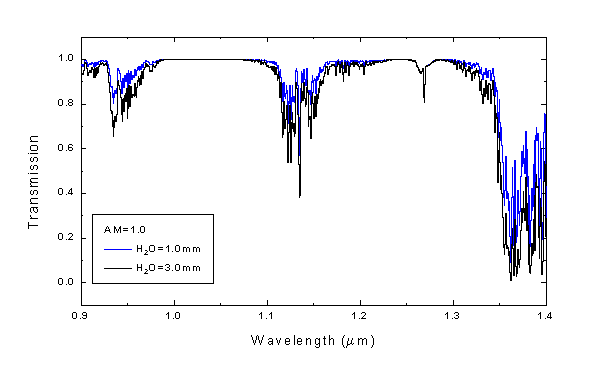
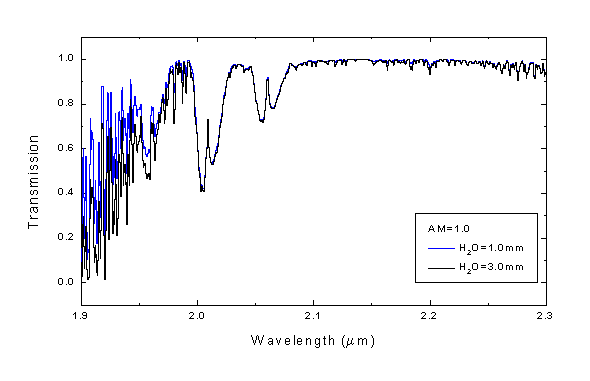
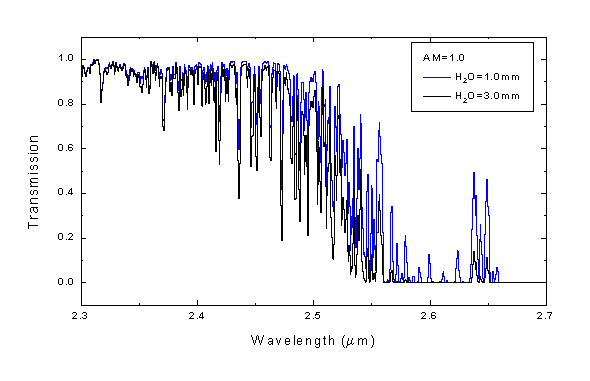
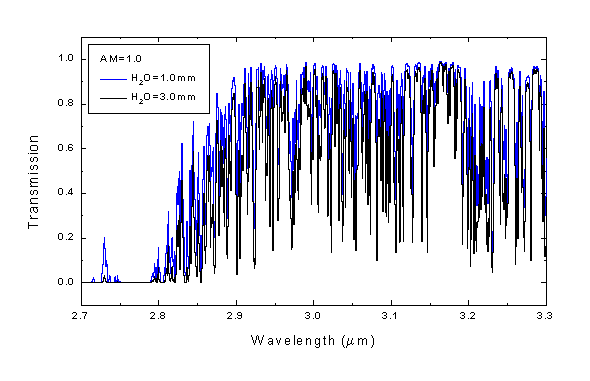
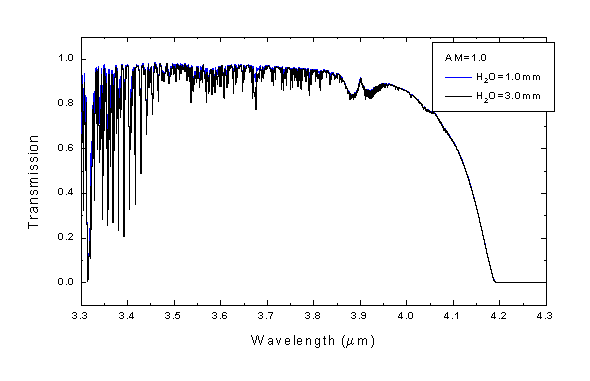
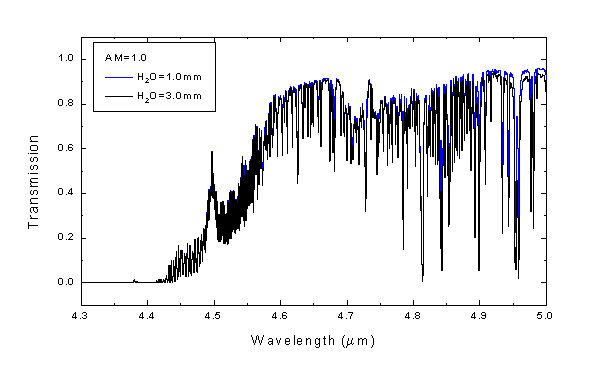
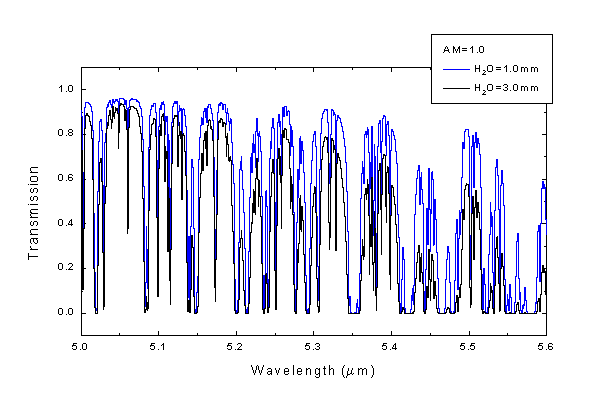
Overview spectra are presented below for the wavelength ranges 0.9 - 2.7 and 2.7 - 5.6µm with a water vapour column of 1.6mm and an air mass of 1.0. To assess appropriate observing condition constraints, the effects of water vapour and air mass can be examined on an expanded wavelength scale by clicking on the upper (red) or lower (blue) bars in the images. Doing so will show examples corresponding to (blue bar) 1.0 and 3.0mm precipitable water vapour at AM=1.0 and (red bar) AM=1.0 and 2.0 at 1.0mm H2O.
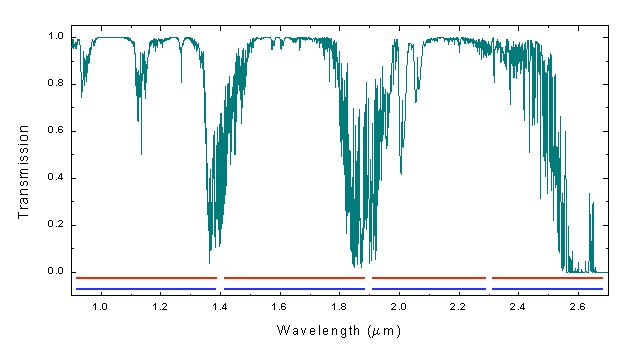
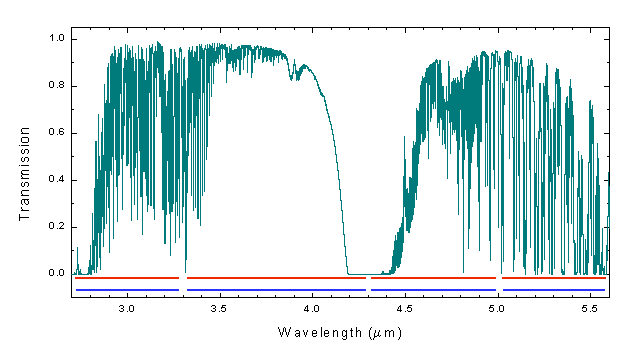
If image maps are not supported by your broswer the expanded spectra
may be displayed by selecting the appropriate wavelength range:
![]() AM=1.0 and 2.0 at
1.0mm precipitable water vapour: 0.9 - 1.4, 1.4 - 1.9, 1.9 - 2.3, 2.3 - 2.7, 2.7 - 3.3, 3.3 - 4.3, 4.3 - 5.0 and 5.0 - 5.6µm
AM=1.0 and 2.0 at
1.0mm precipitable water vapour: 0.9 - 1.4, 1.4 - 1.9, 1.9 - 2.3, 2.3 - 2.7, 2.7 - 3.3, 3.3 - 4.3, 4.3 - 5.0 and 5.0 - 5.6µm
![]() 1.0 and 3.0mm
H2O at AM=1.0: 0.9 - 1.4,
1.4 -
1.9, 1.9 - 2.3, 2.3 - 2.7, 2.7 - 3.3, 3.3 - 4.3, 4.3 - 5.0 and 5.0 - 5.6µm
1.0 and 3.0mm
H2O at AM=1.0: 0.9 - 1.4,
1.4 -
1.9, 1.9 - 2.3, 2.3 - 2.7, 2.7 - 3.3, 3.3 - 4.3, 4.3 - 5.0 and 5.0 - 5.6µm
The raw data files generated by ATRAN are also available via the following table. Any use of these data should reference Lord (1992) and acknowledge Gemini Observatory. The models are in ASCII two-column format: (a) wavelength with a sampling of 0.0005µm and a resolution of 0.001µm (1nm) and (b) transmission.(In most browsers, hold down the shift key when clicking to save the data to a file).
| air mass | Water vapour column | ||
| 1.0mm | 1.6mm | 3.0mm | |
| 1.0 | trans_10_10.dat | trans_16_10.dat | trans_30_10.dat |
| 1.5 | trans_10_15.dat | trans_16_15.dat | trans_30_15.dat |
| 2.0 | trans_10_20.dat | trans_16_20.dat | trans_30_20.dat |
High resolution data (sampled at 0.05nm with a resolution of 0.1nm)
are also available for the
wavelength range 0.9-1.6µm.
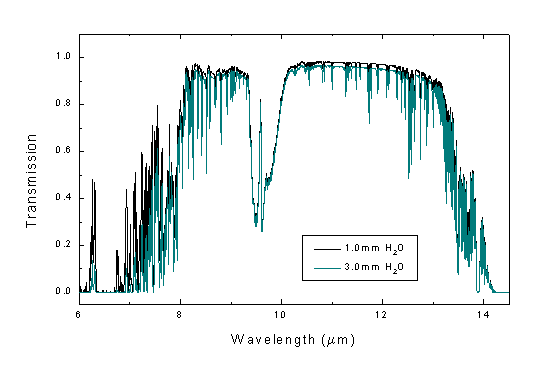
The atmospheric absorption in the 10µm-window is characterised mainly by CO2 and ozone. The principal effect of an increase in the water vapour column above the site is an overall reduction of transmission, and consequent increase in the sky background, as shown by the curves for 1.0 and 3.0mm of H2O in the following figure:
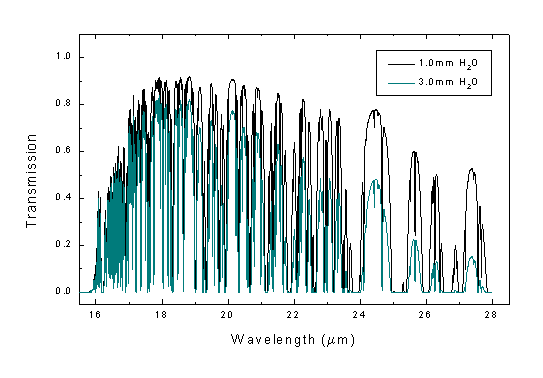
The far greater atmospheric absorption in the 20µm window is dominated by water vapour, as shown by the curves for 1.0 and 3.0mm of H2O in the following figure:
The raw data files used to produce these figures are available: 1.0mm, 1.6mm, 3.0mm, 5.0mm (all at airmass=1.5). Any use of these data should reference Lord (1992) and acknowledge Gemini Observatory. The models are in ASCII two-column format: (a) wavelength with a sampling of 0.0005µm and a resolution of 0.001µm (1nm) and (b) transmission.(In most browsers, hold down the shift key when clicking to save the data to a file).
![]()
![]()
![]()
Last update December 14, 1999; Phil Puxley
and Tom Geballe