
 |
GMOS Data Format and Example Data |
The raw images from GMOS are MEF files with a PHU and one or more pixel extensions. For full frame read-outs (and most other science images) the number of pixel extensions match the number of amplifiers used. Thus, the images have either three or six pixel extensions. Most science observations will be done using the amplifiers with the lowest noise and therefore have three pixel extensions. In the following only MEF files with three pixel extensions are used as examples. Examples for MEF files with six pixel extensions will be added later.
The raw images from GMOS can be displayed one extension at the time using the IRAF task display and specifying the extension. Alternatively, all three extensions can be displayed together using the task gdisplay. The extensions can also be mosaiced together to one extension using the task gmosaic. The two tasks are included in the Gemini IRAF package for GMOS (soon to be released).
The imaging field of view does not cover the detector array completely. The gaps between the detectors cause small gaps on the sky coverage for a single observation. The gaps are approximately equivalent to 39 unbinned GMOS pixels (roughly 2.8 arcsec). To cover the gaps, it is recommended to use dither steps of at least 5 arcsec in the X-direction. The figure below shows an example of a single imaging exposure with the gaps and the imaging field of view labelled.
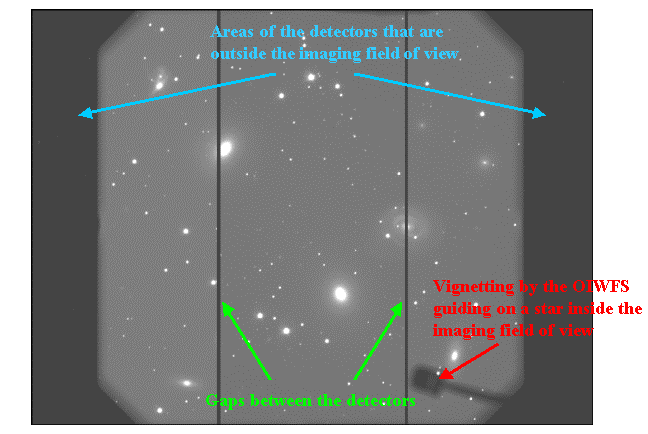
A GMOS imaging observation. The gaps between the detectors as well as the areas of the detectors outside the imaging field of view are shown. For this observation a guide star was used inside the imaging field of view. Thus, the OIWFS is vignetting a small part of the field.
The dispersion direction of GMOS is along the rows of the image. Thus, the gaps between the detectors cause small gaps in the wavelength interval covered by a single observation. The gaps are approximately 39 unbinned GMOS pixels. The equivalent gap in the wavelength coverage depends on the grating used for the observation.
The longest wavelengths are at small X pixel coordinates in extension [1], the shortest wavelengths are at large X pixel coordinates in extension [3]. Thus, when the image has been displayed with gdisplay or mosaiced together with gmosaic the longest wavelengths are to the left and the shortest wavelengths to the right. The figures below show example longslit spectra with the wavelength direction and the gaps marked.
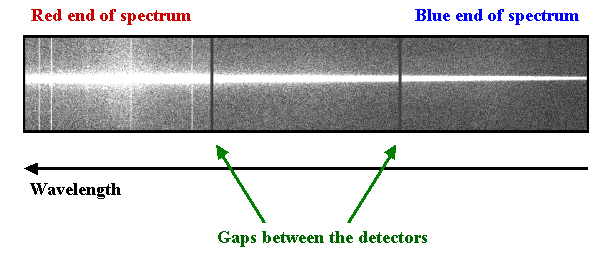
A typical GMOS observation of a spectrophotometric standard star. Only the central 1024 rows of the detector array are read out for this type of observation. The gaps between the detectors are shown.
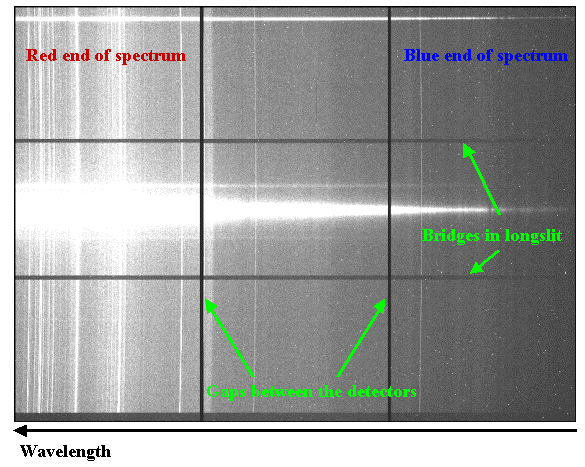
A GMOS longslit observation of a nearby galaxy. The full detector array is read out. The gaps between the detectors are shown. The longslits have bridges, causing small gaps in the spatial coverage. These bridges are necessary in order to keep the slit stable.
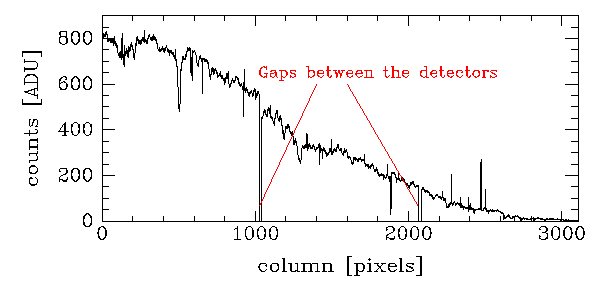
The average of the central 20 rows of the galaxy spectrum shown above. An approximate sky subtraction has been applied. No wavelength calibration or flux calibration have been applied. The gaps between the detectors are shown.
Examples of raw MOS data from GMOS are shown on the Hot News page from Sept 27, 2001.
Examples of IFU data from GMOS are shown on the GMOS IFU page.
As part of the data quality assessment most GMOS imaging data are processed as follows.
After these processing steps the output image is a MEF file with a PHU and one pixel extension.
For observations that consist of several exposures at different dither positions, the images are registered and co-added. In the process of co-adding the images are cleaned for cosmic-ray-events and bad pixels, including the gaps between the detectors if the dither steps are of sufficient size. An example of a reduced co-added image is shown on the figure below.
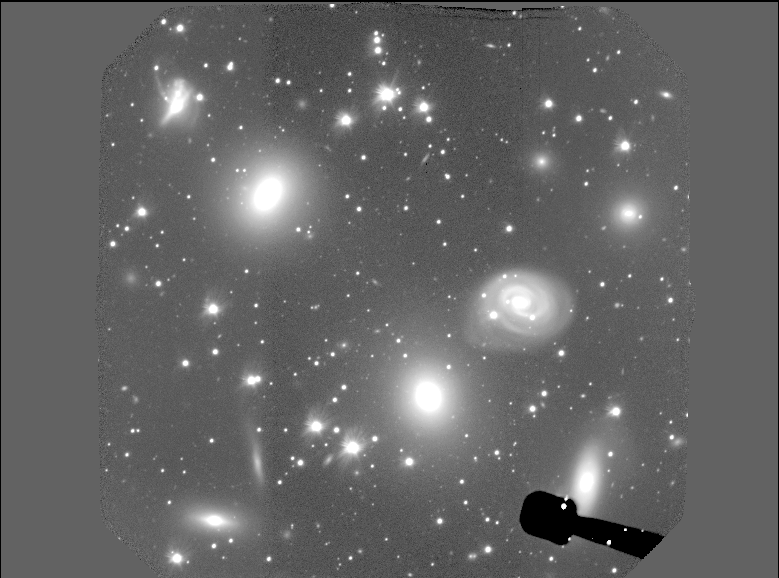
A reduced and co-added GMOS imaging observation. For this observation a guide star was used inside the imaging field of view. Thus, the OIWFS is vignetting a small part of the field.
Last update February 23, 2002; Inger Jørgensen