![[GMOS logo]](gmoslogo.gif)
| You are in: Instruments > GMOS > Performance and Use > GMOS Components > IFU |
| |
Integral Field Units (IFUs) |
One of the more exceptional features of GMOS is its integral field mode, which provides the ability to do spatially resolved spectroscopy. This mode is based upon using a lenslet array (containing 1500 elements) in the pre-slit environment to slice the focal plane into a multitude of small components. Each lenslet is fiber coupled with the output sent to a linear array of fibers terminating at the nominal location of the slit. From there it is possible to reconstruct an image at a particular wavelength, or extract a spectrum from any point in the field of view. The science field of view is 35 square arcsec (5"x7") and is sampled by 1000 elements. The sky is sampled with 500 elements which are located ~1 arcmin away from the science field of view. The GMOS-N IFU has been available since early 2002. The GMOS-S IFU has been available for science use since April 1, 2004.
In the future this mode may be commissioned for use with Adaptive
Optics. The IFU mode is well suited for AO unit since it makes optimal
use of the AO corrected field, unlike a slit which of course blocks
much of the corrected field. Currently the Altair AO facility
instrument on Gemini North only transmits light longward of 835 nm to
the science
instruments, so the GMOS-N would only have access to a limited
wavelength range. Plans to upgrade
the CCDs on both GMOSs to more red sensitive detectors may make
commissioning GMOS-N with AO a more
attractive option.
Because there is no Atmospheric Dispersion Corrector (ADC) installed in either GMOS-N or GMOS-S, observers of extended sources should be aware that when observing in the blue or with the one-slit mode (longer wavelength coverage) different wavelengths may fall on different lenslets, especially at high airmass. It is possible to correct for this effect when analyzing ones data; however, this capability is currently not available within the GMOS IRAF package.
Basic design
Field to slit mapping
Grating and filter
combinations
Performance
| Lenslet/fiber design | Hexagonal lenslets fully sample the FOV, fibers redirect the light to "slits" for effective detector use | |
| Easy deployment | Slides into the focal plane similar to a slit mask | |
| Wavelength range | 0.4-1.1 microns | |
| IFU format | Two fields separated by 1 arcminute | |
| Projected diameter of individual lenses | 0.2" | |
| Two-slit mode | all fibers used for maximum FOV with limited spectral coverage | |
| One-slit mode | half the number of fibers and FOV for extended wavelength coverage | |
| Fields of View | two-slit mode | one-slit mode |
| "Object" field of view | 5" x 7" (1000 lenslets) | 5" x 3.5" (500 lenslets) |
| Nod & Shuffle field of view (GMOS-S only) | 5" x 5" (700 lenslets) |
5" x 2.5" (350 lenslets) |
| "Sky" field of view | 5" x 3.5" (500 lenslets) | 5" x 1.75" (250 lenslets) |
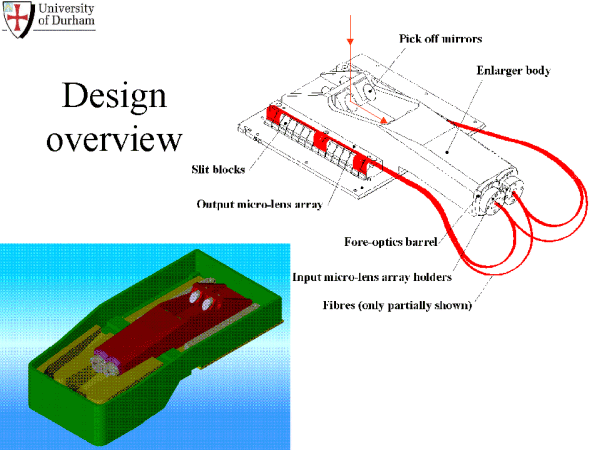
The overall design of the IFU is shown below. The IFU is
stored
in one of the three mask cassette slots and it is inserted into the
beam
as if it were a slit mask. Two pick-off mirrors direct light from
the
focal plane through fore-optics in the enlarger body and onto the
lenslet
arrays. Fibers then reformat the focal plane into two
pseudo-slits
that pass the light into the rest of the spectrograph. Either of
these
slits can be masked off in order to get more wavelength coverage but
half
the field-of-view ("one-slit" mode). The GMOS-S IFU also includes masks
for allowing use of Nod & Shuffle.
The figure below shows the relative positions of the IFU fields and the pseudo-slits in the focal plane. The slits are separated by 175mm. In two-slit mode the long axis of the 'Object' lenslet array is aligned with the dispersion axis of the spectrograph (along the x-axis of the CCDs).
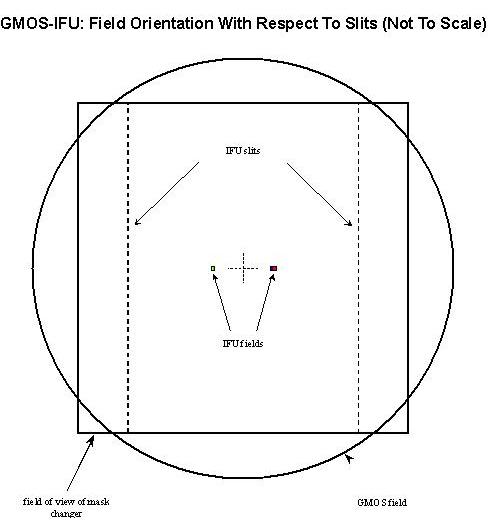
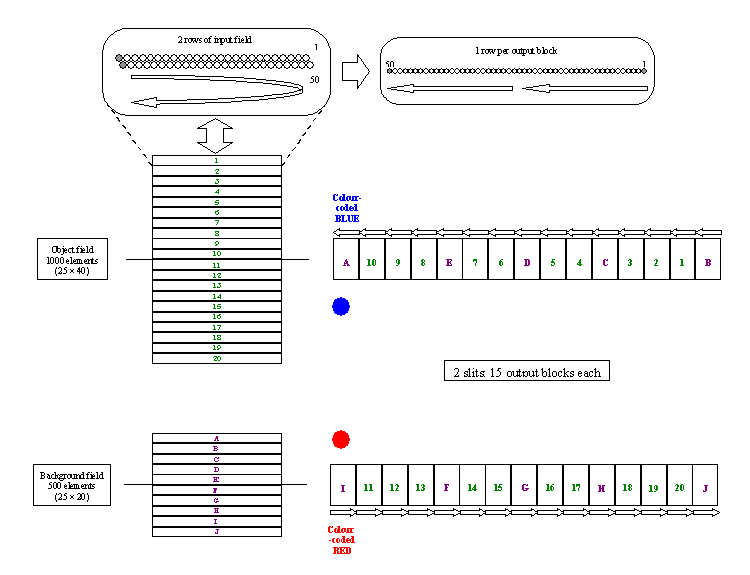
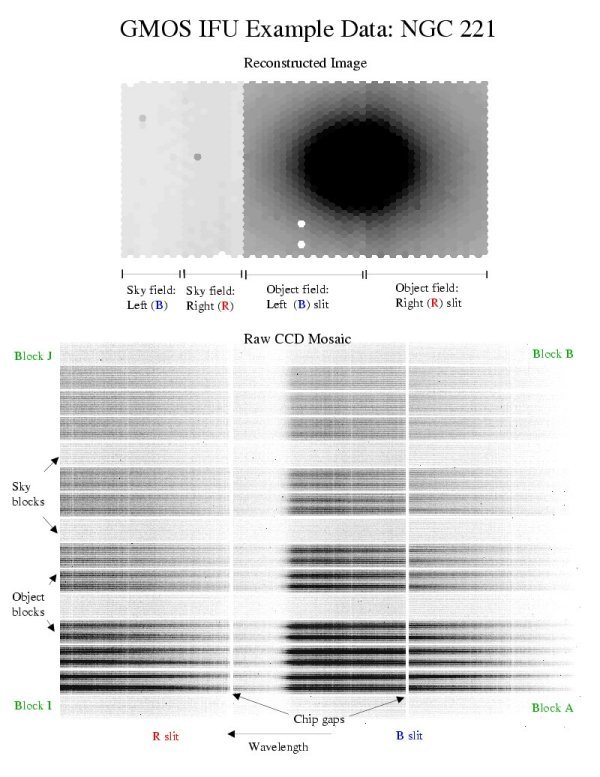
The lenslets are hexagonal in shape and are laid out in rows of 25 lenslets each. Pairs of rows are grouped into "slit blocks" of 50 fibers at the pseudo-slits. The nomenclature for the slit blocks, their locations in the IFU fields, and their mapping onto the detector are illustrated below. Note that the 'sky' lenslets (letters coded purple) are interleaved with the 'object' lenslets (numbers coded green). The right-most halves of the fields on the sky (IFU Right Slit in the OT) are fed to the pseudo-slit marked Red on the IFU itself. These spectra fall on the left (red wavelength) side of the CCD mosaic. Conversely, the left halves of the fields (IFU Left Slit in the OT) end up in the Blue pseudo-slit and fall on the right (blue wavelength) side of the CCD mosaic.
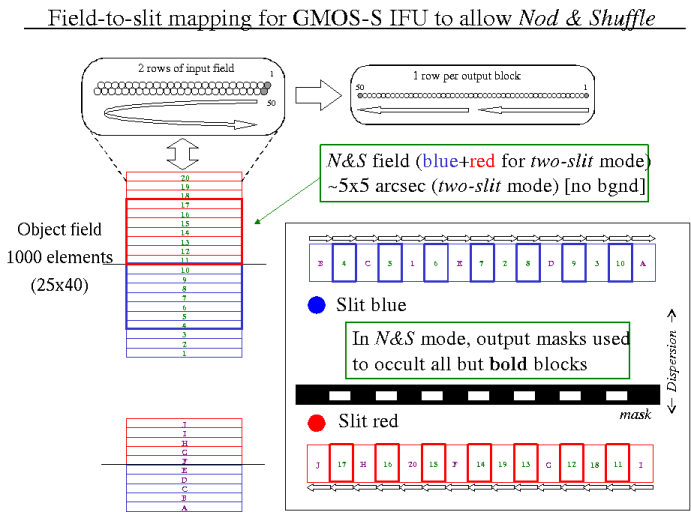
The mapping of the GMOS-S IFU was modified to allow use of the Nod & Shuffle technique for accurate sky subtraction at the expense of a slightly reduced field-of-view and the loss of the smaller, "sky" field. For the IFU, the shuffle distance should be set to 285 rows.
For
both the GMOS-N and GMOS-S IFU the throughputs of the
fibers in the Red slit are both higher and more uniform that those in
the
Blue slit (see below), so observers desiring one-slit mode should
choose
"IFU
Right Slit (red)" for the Focal Plane Unit in their science program.
The relationship between the IFU fields and the layout on the detector for the GMOS-N IFU is further demonstrated with some example data on NGC 221 (M32) below. These data were taken in two-slit mode using the B600 grating, the g filter, and a central wavelength of 475 nm. The obvious step between the halves of the object field is a known flat-field effect (the right slit has higher average throughput than than the left slit) that can be corrected. It was left in for this example so that the halves could be distinguished more easily.
In two-slit mode the broad-band filters can be used to prevent the
two banks of spectra
from overlapping on the detector. The useful combinations of gratings
and filters that allow the use of two slits with no or minimal overlap
are given in the table below. The calculated separations between the
slits in unbinned pixels for the various grating/filter combinations
are
also given.
Differences in the
slit
separations are due to anamorphic magnification. For most of the
configurations below, the complete filter passband fits on the detector
for both slits (typically with a few nm lost due to overlap at the
center). With the B600 (or R600) grating + g filter at 475nm, 11.5nm of
the g passband is lost at either end of the detector, so the blue slit
has slightly less blue coverage and the red slit slightly less red
coverage. In general, one should set
the grating central wavelength to that of the filter for two-slit mode
(+/- 11.5nm for B600+g), to avoid losing spectral range at the ends of
the detector unnecessarily. Small adjustments may be needed to account
for the CCD gaps. For the R150 + GG455, a central wavelength of ~680nm
will cover roughly 460-900nm at both slits (truncating the very red end
of the red slit; longer settings will reach >=1000nm at the expense
of the blue end of the blue slit).
The throughput of the GMOS-N IFU has been measured by comparing the
total flux in a GCAL imaging flat at the positions of the IFU fields
with the flux through
the IFU with no disperser in the beam. The throughputs for
different
wavelength are shown in the table below. The fiber-to-fiber
variation
in the throughput is about 6% for spectra in the center of the CCD and
there
is a ~30% reduction in throughput near the ends of the slits due to
vignetting.
Currently the flat-fielding is good to about 5%, varying between 3% and
10%
depending on the slit block. The method is still being improved.
| Filter | Throughput |
| g | 62% |
| r | 65% |
| i | 62% |
| z | 58% |
Sensitivity estimates can be found on the GMOS Spectroscopic Sensitivity page which were derived using the GMOS Integration Time Calculator (ITC). Note that the ITC reports results for single IFU elements.
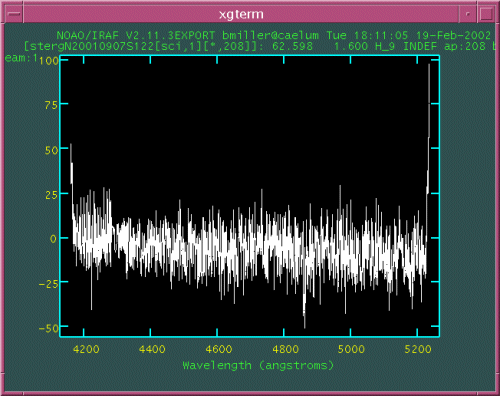
Sky subtraction is done by averaging all spectra in a specified sky area (all the fibers in the "Sky" field, for example) and then subtracting the mean sky spectrum from all spectra in the cube. It is working well, though there can be gradients in the residuals with wavelength on the order of 5% (see figure below). Sky subtraction is sensitive to the flat-fielding accuracy, so it should improve as the flat-fielding improves.
![]()
![]()
Last update: January 7, 2007; Rodrigo Carrasco
Previous version: October 20, 2006; Rachel Johnson, Kathy
Roth