Announcements
Wavelength calibration of GMOS is obtained using GCAL, the facility calibration unit. Flat-fielding is done with GCAL or on the sky during twilight. Baseline calibrations will be obtained for all observations, both queue and classical.
GMOS Baseline Calibrations
For all queue observations a set of standard calibrations (the "baseline calibrations"), shown in the tables below, will be taken by Gemini Staff to ensure the long-term utility of data in the archive. The baseline calibration set varies from instrument to instrument and from mode to mode.
Since 2017B the time required for nighttime baseline calibrations has to be included in the "Total Time" requested during Phase I. The required "Night Basecal Time" per observation is automatically calculated by the Phase I Tool (PIT). If additional calibrations are deemed necessary by applicants, for example to achieve a precision beyond that achievable via the baseline set, then these must be included explicitly as part of the Phase I proposal and Phase II science program. Note that all calibrations, including baseline arcs, flats, spectral response standards and Nod & Shuffle Darks must be included in the Phase II science program.
Baseline calibration data may be shared between programs and will be distributed to the users as part of their dataset. Any time used between the hours of nautical sunset and sunrise to obtain baseline calibrations will not be explicitly charged to the program but will be charged to the partner country whose NTAC recommended time (i.e. it is part of the time accounting used to balance partner usage). The time will be charged in proportion to the number of programs that receive the calibration data. Any time required for additional calibrations requested by the PI will be charged to that particular program.
For Nod-and-Shuffle observations all baseline calibrations (with the exception of the Nod & Shuffle Darks) will be taken without Nod-and-Shuffle, e.g. spectrophotometric standard stars will not be taken with Nod-and-Shuffle.
All calibration data is available through the Gemini Observatory Archive. All raw data is available as well as processed biases, imaging twilight flats, and some standards.
GMOS Imaging Mode
| Measurement Type | Notes |
| Bad pixel mask | Derived each semester from dome flats and bias images. May be derived more often if changes in the detector array are found. The bad pixel mask for the imaging mode will show the areas outside the imaging field of view as bad pixels, even though the pixels are not strictly bad, just not illuminated by the imaging field of view. |
| Flat field | Imaging twilight flats are taken each day as the weather allows. All twilight flats from a 10-14 night dark period are combined in order to built a high S/N flat field. The typical noise in the avarage of the twilight flats that can be obtained in a given run is 0.75 percent. Dome flats may also be taken, but are not guaranteed to be part of the baseline calibration set. All flat fields are obtained in slow read, low gain mode. Other readout modes can use the same flat fields when the ratios of the gains for the different readout modes are taken into account. |
| Fringe Frames | GMOS images show some fringing in z' and Y bands. One set of blank sky images in these bands is taken once per semester for fringe frame generation. These fringe frame images are taken as part of baseline calibration. However, users may find that better fringe frames can be generated from the science imaging data and if possible should consider including multiple dithers for their imaging science data. |
| Dark / Bias | The dark current for GMOS is <1.0e-/hour. Dark images are normally not taken. Bias images are taken regularly in the readout modes and binnings used for the science observations. Due to the spatial bias structure as well as bias level variations over time, it is recommended to apply overscan subtraction in addition to bias subtraction. |
| Wavelength calibration | Not applicable |
| Telluric standard star | Not applicable |
| Flux standard stars | Selected from Landolt (1992, AJ, 104, 340). Each observed field contains 3-5 standard stars. A minimum of one field is observed each photometric night during which imaging programs are carried out. Observations of standard stars are only obtained in broadband filters used for the science observations. Approximate zero points are also available. Photometric accuracy is limited to ~5% by the uncertainty in the (unmeasured) atmospheric extinction. |
| Atmospheric extinction | Not included as part of the baseline calibration set. |
| Point Spread Function star | Not included as part of the baseline calibration set. |
| World coordinate system | Automatically included for each GMOS image. Relative accuracy is better than 0.2 arcsec on average over the field. Absolute accuracy is about 5 arcsec. |
| Focal plane mask image | Not applicable. |
| Special standards | Not applicable. |
GMOS Long-slit Mode
| Measurement Type | Notes |
| Bad pixel mask | Derived each semester from dome flats and bias images. May be derived more often if changes in the detector array are found. The bad pixel mask for the long-slit mode will show the bridges in the long-slits, even though the pixels are not strictly bad, just not illuminated by the long-slit observations. |
| GCAL flat field | GCAL flats are taken mixed with the science observations. For science programs one GCAL flat is obtained for each hour of open shutter time. For standard star observations, only one GCAL flat is obtained. This is sufficient since the standard star observations have significantly higher S/N than most science observations. |
| Dark / Bias | The dark current for GMOS is <1.0e-/hour. Dark images are normally not taken. Bias images are taken regularly in the readout modes and binnings used for the science observations. Due to the spatial bias structure as well as bias level variations over time, it is recommended to apply overscan subtraction in addition to bias subtraction. Nod & Shuffle Darks are not necessary with the current detectors but can be defined by the PI, in which case they will be taken on a best-effort basis when the telescope is closed for bad weather. |
| Wavelength calibration | CuAr arc exposures matching the configuration (grating, filter, slit width, CCD binning) are obtained as part of the baseline calibrations. Starting from semester 2024B, the CuAr exposures are taken as nighttime partner calibrations, mixed with the science observations. For each central wavelength setting, one CuAr arc is provided for each hour of open shutter time. Before semester 2024B, CuAr arcs were taken as daytime calibrations. On-sky arcs were only provided as baseline calibrations for spectroscopy blueward of the 557.7 nm sky line (i.e. B1200 configurations using central wavelenghts <= 480 nm or B600 configurations using central wavelengths <= 405 nm). |
| Twilight flat field | Twilight flats, which provide information about the slit function, are usually not taken for longslit programs, but can be provided if requested (and defined) by the PI. Each twilight flat exposure, matching the science configuration, is obtained once per semester. Twilight flats are considered baseline calibrations and are not charged to the program. |
| Telluric standard star | The flux standard stars may be use for approximate removal of telluric lines but the observations of the flux standard are not guaranteed to be obtained during the same nights as the science observations for the program. |
| Flux standard stars | Selected from the sources listed on the GMOS spectrophotometric standard star page. For each configuration (grating, filter, slit width, CCD binning) used by a science program, one spectrophotometric standard star is observed per semester. Observations are not guaranteed to be obtained during the same nights as the science observations for the program. Observations to provide absolute spectrophotometric calibration are not included as part of the baseline calibration set. |
| Atmospheric extinction | Not included as part of the baseline calibration set. |
| Point Spread Function star | Not included as part of the baseline calibration set. |
| World coordinate system | Automatically included for each GMOS image. Relative accuracy is better than 0.2 arcsec on average over the field. Absolute accuracy is about 5 arcsec. |
| Focal plane mask image | Images of the long-slits are obtained regularly for monitoring the quality of the slits. The images are not distributed as part of the baseline calibration set. |
| Special standards | Radial velocity standards are not observed routinely as part of baseline calibrations. Any program that requires radial velocity standards should include these observations in the phase II for the program. |
GMOS multi-object spectroscopy mode
| Measurement Type | Notes |
| Bad pixel mask | Not included as part of the baseline calibration set. The user may use the bad pixel mask for the long-slit mode. |
| GCAL Flat field | GCAL flats are taken mixed with the science observations. For science programs one GCAL flat is obtained for each hour of open shutter time. |
| Dark / Bias | The dark current for GMOS is <1.0e-/hour. Dark images are normally not taken. Bias images are taken regularly in the readout modes and binnings used for the science observations. Due to the spatial bias structure as well as bias level variations over time, it is recommended to apply overscan subtraction in addition to bias subtraction. Nod & Shuffle Darks are not necessary with the current detectors but can be defined by the PI, in which case they will be taken on a best-effort basis when the telescope is closed for bad weather. |
| Wavelength calibration | CuAr arc exposures matching the configuration (grating, filter, slit width, CCD binning) are obtained as part of the baseline calibrations. Starting from semester 2024B, the CuAr exposures are taken as nighttime partner calibrations, mixed with the science observations. For each central wavelength setting, one CuAr arc is provided for each hour of open shutter time. Before semester 2024B, CuAr arcs were taken as daytime calibrations. On-sky arcs were only provided as baseline calibrations for spectroscopy blueward of the 557.7 nm sky line (i.e. B1200 configurations using central wavelenghts <= 480 nm or B600 configurations using central wavelengths <= 405 nm). |
| Twilight Flat field | Twilight flat observations, if requested (and defined) by the PI, are taken through each MOS mask with the configuration (grating, wavelength, CCD binning) matching the science observations. The twilight flat can be used to derive the slit function for the mask. The exposure is obtained once per semester. Twilight flats are considered baseline calibrations and are not charged to the program. |
| Telluric standard star | The flux standard stars may be use for approximate removal of telluric lines but the observations of the flux standard are not guaranteed to be obtained during the same nights as the science observations for the program. |
| Flux standard stars | Selected from the sources listed on the GMOS spectrophotometric standard star page. For each configuration (grating, filter, slit width, CCD binning) used by a science program, one spectrophotometric standard star is observed per semester. Observations are not guaranteed to be obtained during the same nights as the science observations for the program. Standard stars are observed using the standard set of long-slits. If a MOS program uses a non-standard slitwidth, the standard star observations will be obtained through the long-slit with a slit width closest to the one used by the MOS program. Observations to provide absolute spectrophotometric calibration are not included as part of the baseline calibration set. |
| Atmospheric extinction | Not included as part of the baseline calibration set. |
| Point Spread Function star | Not included as part of the baseline calibration set. |
| World coordinate system | Automatically included for each GMOS image. Relative accuracy is better than 0.2 arcsec on average over the field. Absolute accuracy is about 5 arcsec. |
| Focal plane mask image | Each MOS mask is imaged once using GCAL as the illumination source. The imaging is done with the r'-filter. The image is supplied as part of the baseline calibration set. |
| Special standards | Radial velocity standards are not observed routinely as part of baseline calibrations. Any program that requires radial velocity standards should include these observations in the phase II for the program. |
GMOS IFU mode
| Measurement Type | Notes |
| Bad pixel mask | Not included as part of the baseline calibration set. |
| GCAL Flat field | GCAL flats are taken mixed with the science observations. For science programs one GCAL flat is obtained for each hour of open shutter time. |
| Dark / Bias | The dark current for GMOS is <1.0e-/hour. Dark images are normally not taken. At least 20 bias images are taken each month in the readout modes and binnings used for the science observations. Due to the spatial bias structure as well as bias level variations over time, it is recommended to apply overscan subtraction in addition to bias subtraction. Nod & Shuffle Darks are not necessary with the current detectors but can be defined by the PI, in which case they will be taken on a best-effort basis when the telescope is closed for bad weather. |
| Wavelength calibration | CuAr arc exposures matching the configuration (grating, filter, slit width, CCD binning) are obtained as part of the baseline calibrations. Starting from semester 2024B, the CuAr exposures are taken as nighttime partner calibrations, mixed with the science observations. For each central wavelength setting, one CuAr arc is provided for each hour of open shutter time. Before semester 2024B, CuAr arcs were taken as daytime calibrations. On-sky arcs were only provided as baseline calibrations for spectroscopy blueward of the 557.7 nm sky line (i.e. B1200 configurations using central wavelenghts <= 480 nm, or B600 configurations using central wavelengths <= 405 nm, or IFU-2 configurations using B600+g', B1200+g'+OG515, R831+g'+GG455, or R600+g'). |
| Twilight flat field | Twilight flat observations are taken through the appropriate IFU with the configuration (grating, wavelength, CCD binning) matching the science observations. The exposure is obtained once per semester. Twilight flats are considered baseline calibrations and are not charged to the program. |
| Telluric standard star | The flux standard stars may be use for approximate removal of telluric lines but the observations of the flux standard are not guaranteed to be obtained during the same nights as the science observations for the program. |
| Flux standard stars | Selected from the sources listed on the GMOS spectrophotometric standard star page. For each configuration (grating, filter, IFU configuration, CCD binning) used by a science program, one spectrophotometric standard star is observed per semester. Observations are not guaranteed to be obtained during the same nights as the science observations for the program. Observations to provide absolute spectrophotometric calibration are not included as part of the baseline calibration set. |
| Atmospheric extinction | Not included as part of the baseline calibration set. |
| Point Spread Function star | Not included as part of the baseline calibration set. |
| World coordinate system | Automatically included for each GMOS image. Relative accuracy is better than 0.2 arcsec on average over the field. Absolute accuracy is about 5 arcsec. |
| Focal plane mask image | Images of the IFU are obtained regularly for monitoring the quality of the fibers. The images are not distributed as part of the baseline calibration set. |
| Special standards | See the long-slit mode for information regarding radial velocity standards. |
Flat/Arc Exposure Times
GCAL configurations and Exposure Times for GMOS calibrations: Quartz Halogen flats and CuAr arcs
Note the following:
- Exposure times for GCAL GMOS calibrations are set automatically in the OT ('SmartGCals'). Please use the exposure times provided in the OT for flats and arcs.
- If you are choosing to use a manual arc or flat, you can first set up a (Smart-) "Arc" or "Flat" to find the automatically-set exposure times. Then click the "Configure Manually" button in the corresponding 'Sequence Component'.
- For manual flats, please use GCALlamp=Quartz-Halogen, GCALdiffuser=VISIBLE. For manual arcs, please choose the CuAr arc and GCALdiffuser=VISIBLE.
- The GMOS-N and GMOS-S detector controllers only support integer exposure times.
- The GMOS gratings (with the exception of the R150) have significant scattered light, since the QH lamps are very red and arc lamps have very strong red lines.
Photometric Standards
Observations of photometric standard stars are included in the baseline calibrations for GMOS. These observations allow to calibrate the data acquired into a magnitude or flux scales.
Like the SDSS, the magnitudes in the GMOS filters are on the AB system,
mAB = -2.5 log fnu,eff - 48.60 ,
where fnu,eff is the effective flux in erg/cm2/s/Hz. A description of the SDSS photometric system is presented in Fukugita et al. (1996, AJ, 111, 1748). Fukugita et al. (1996) also give transformations between AB magnitudes and magnitudes in conventional systems.
For GMOS baseline calibrations photometric standard stars are chosen from the sources listed in the table below. The magnitudes for Landolt (1992) standard stars are transformed to AB magnitudes using the transformation equations given in Fukugita et al. (1996)*. Accurate empirical transformations between the GMOS instrumental magnitudes and the Johnson-Kron-Cousins system are not available, however these may be established as part of GMOS engineering in a near future. For GMOS-N and GMOS-S, baseline calibration photometric standard stars are observed in a regular basis. For GMOS-N, the main source are the Landolt (1992) and Smith at al. (2002) standard star catalogs. Starting from 2008B semester, standard stars from Landolt (1992) catalog are not longer used at Gemini South. The main calibration source for GMOS at Gemini South is a standard star catalog calibrated directly in the SDSS system: the Southern u'g'r'i'z' standard star catalog from Smith et al. (2007). Finding charts (from Ryder, Murrowod and Stathakis 2006) provided here.
| GMOS Photometric Standard Stars | |||
| Reference | Declination coverage |
||
| Landolt (1992, AJ, 104, 340) * | -46 deg to +13 deg | ||
| Smith et al. (2002, AJ, 123, 2121) | -25 deg to +75 deg | ||
| Smith et al (2007, AJ, submitted) Southern u'g'r'i'z' Standard Catalogs web page |
-84 deg to +09 deg | ||
| UKIRT MKO ZY+IR standards | -20 deg to 40 deg | ||
* The Landolt (1992) standard star magnitudes in the SDSS u'g'r'i'z' system are part of the GMOS calibration files included in the Gemini IRAF package.
Images of standard star field are observed in a regular basis as part of the GMOS (North and South) instruments monitoring. Data are reduced with the GEMINI/GMOS reduction package and photometric calibrations for the u' g' r' i' and z' GMOS filters are derived. The calibrations presented below are accurate to 5-10 percent for nights with atmospheric extinction close to the median value for Mauna Kea and Cerro Pachon.
The approximate photometric zero points for all images observed under photometric conditions are derived as follows:
mstd = mzero - 2.5 log10 (N[-e]/exptime) - kMK (airmass-1.0) (1)
where exptime is the exposure time contained in the keyword EXPTIME in the primary header unit of the images, the airmass is contained in the keyword AIRMASS in the primary header unit, N[e-] is the electrons inside the aperture and above the sky level and kMK is the median atmospheric extinction at Mauna Kea. Note that no color term is included in the equation.
GMOS-N EEVs
The photometric zero points listed in the table below were derived by Jørgensen (2009, PASA, 26, 17)) using the Landolt standard star fields. The values listed in this table for the original EEV CCDs are from the night of UT 2003 November 21. For a complete discussion about color terms and systematic effects in the calibrations see the above publication.
| GMOS-N EEVs | ||
| Filter | mzero | KMK |
| u' * | 25.47 * | 0.42 |
| g' | 27.95 | 0.14 |
| r' | 28.20 | 0.11 |
| i' | 27.94 | 0.10 |
| z' | 26.78 | 0.05 |
* For GMOS at Gemini North, the u' filter is no longer available.
GMOS-N E2V-DD
For the GMOS-N E2V-DD zeropoints, please use GMOS (North) instruments monitoring since the zeropoints have a time dependence.
| GMOS-N E2V-DD | ||||
| Filter | mzero | KMK | CT | (c1 - c2) |
|---|---|---|---|---|
| g' | 28.24 | 0.14 | 0.045 | (g' - r') |
| r' | 28.34 | 0.11 | 0.037 | (g' - r') |
| r' | 28.34 | 0.11 | 0.069 | (r' - i') |
| i' | 28.43 | 0.10 | 0.124 | (r' - i') |
| z' | 27.68 | 0.05 | 0.143 | (i' - z') |
GMOS-N Hamamatsu
For the GMOS-N Hamamatsu zeropoints, in operation since March 2017, please use GMOS (North) instruments monitoring since the zeropoints have a time dependence.
| GMOS-N Hamamatsu | ||||
| Filter | mzero | KMK | CT | (c1 - c2) |
|---|---|---|---|---|
| g' | 28.09 | 0.14 | 0.069 | (g' - r') |
| r' | 28.35 | 0.11 | 0.03 | (g' - r') |
| r' | 28.35 | 0.11 | 0.062 | (r' - i') |
| i' | 28.42 | 0.10 | 0.105 | (r' - i') |
| z' | 28.19 | 0.05 | 0.09 | (i' - z') |
See also the page about Airglow at Maunakea (in the GMOS document section.)
The photometric zero point calibration for all images observed under photometric conditions are derived as follows:
mstd = mzero - 2.5 log10 (N[-e]/exptime) - kCP (airmass-1.0) + CT (color1 - color2) (2)
where exptime, airmass and N[e-] have the same meaning as in equation (1), CT is the color term and kCP is the mean atmospheric extinction coefficient at Cerro Pachon. The adopted median atmospheric extinction coefficients is a median value of the period 2003 - 2008. The table shows the zero points, the adopted median extinction coefficients and the color terms derived for the night of 2008 May 13UT, using the Southern u'g'r'i'z' standard star catalog from Smith et al. (2007). An early photometric calibration from GMOS on Gemini South, utilizing the standard stars calibrated directly in the SDSS system, is given in Ryder, Murrowod and Stathakis (2006,MNRAS, 369, L32).
A link to finding charts from Ryder, Murrowod and Stathakis (2006) is available here. (Gemini thanks our colleagues at the AAO ITSO Office for preparing this information in conjunction with Macquarie University's Professional and Community Engagement program)
| Filter | mzero | KCP | CT | (c1 - c2) |
|---|---|---|---|---|
| u' | 24.13 | 0.38 | 0.03 | (u' - g') |
| g' | 27.99 | 0.18 | 0.05 | (g' - r') |
| r' | 28.24 | 0.10 | -0.01 | (g' - r') |
| i' | 28.23 | 0.08 | -0.02 | (r' - i') |
| z' | 28.02 | 0.05 | -0.04 | (i' - z') |
| Filter | mzero | KCP | CT | (c1 - c2) |
| u' | 24.91 | 0.38 | -0.02 | (u' - g') |
| g' | 28.33 | 0.18 | -0.06 | (g' - r') |
| r' | 28.33 | 0.10 | -0.02 | (g' - r') |
| i' | 27.93 | 0.08 | -0.02 | (r' - i') |
| z' | 26.84 | 0.05 | 0.00 | (i' - z') |
As part of an engineering at Gemini South, accurate zero points and color terms determination have been obtained for each of the GMOS CCDs separately. Following equation (2), the zero point and the color term for each detector are listed in the table below. The atmospheric extinction values used in the photometric calibration are the median values for Cerro Pachon listed in the previous table. Note that for the Hamamatsu CCDs, the color terms are quite different from one CCD to another. For the E2Vs, all color terms in CCD2 and CCD3 are very similar (except for the z' filter) while CCD1 has different color terms in all filters except in u'.
If the user requires a 1% - 2% accuracy in the photometry, CCD-by-CCD photometric calibration may be needed. Note that observations of standard star fields for accurate photometry (1% - 2%) are not part of Baseline calibration and may be included in the phase I proposal.
NEW! per-detector values for the HAMAMATSU CCDs*: Updated values (2019) for each detectors can be found here and summarized in the following table:
|
CCDr (BI5-36-4k-2) |
CCDg (BI11-33-4k-1) |
CCDb (BI12-34-4k-1) |
|||||
|---|---|---|---|---|---|---|---|
| Filter | mzero | CT | mzero | CT | mzero | CT | (c1 - c2) |
| u' | 23.71 | 0.19 | 24.02 | 0.02 | 24.02 | 0.03 | (u' - g') |
| g' | 27.83 | 0.08 | 27.83 | 0.12 | 27.88 | 0.05 | (g' - r') |
| r' | 28.10 | 0.02 | 28.13 | 0.04 | 28.09 | 0.06 | (g' - r') |
| i' | 28.15 | 0.12 | 28.11 | 0.04 | 28.11 | 0.16 | (r' - i') |
| z' | 27.98 | 0.03 | 27.93 | 0.12 | 27.93 | 0.27 | (i' - z') |
*(based on photometric observations gathered during 2019). Mean uncertainties in zero points are +/- 0.02mag and +/- 0.03mag in the color terms.
Values for the E2V detectors (removed on May 2014) :
|
CCD1 (EE 2037-06-03) |
CCD2 (EEV 8194-19-04) |
CCD3 (EEV 8261-07-0) |
|||||
| Filter | mzero | CT | mzero | CT | mzero | CT | (c1 - c2) |
| u' | 24.936 | -0.014 | 24.913 | -0.002 | 24.941 | -0.010 | (u' - g') |
| g' | 28.303 | -0.105 | 28.312 | -0.048 | 28.343 | -0.057 | (g' - r') |
| r' | 28.330 | -0.030 | 28.320 | -0.023 | 28.355 | -0.006 | (g' - r') |
| i' | 27.916 | -0.165 | 27.921 | -0.047 | 27.955 | -0.044 | (r' - i') |
| z' | 26.828 | -0.125 | 26.837 | -0.038 | 26.867 | +0.067 | (i' - z') |
Spectroscopic Stds
Observations of spectrophotometric standard stars are required in order for spectra obtained by GMOS to be flux-calibrated. For spectra at wavelength longwards of about 680nm, calibration spectra of hot stars are needed if cancellation of telluric features in the spectrum is required.
Baseline calibrations spectrophotometric standard stars are chosen for GMOS from the sources listed in the following table. When wavelength coverage redwards of 810nm is required, standard stars for Gemini North will be stars that are included in both Massey & Cornwall (1990) and Massey et al. (1988), while for Gemini South standards stars from Hamuy et al. (1994) will be observed.
| GMOS Spectrophotometric Standard Stars | |||
| Reference | Declination coverage |
Wavelength coverage |
Wavelength intervals |
| Massey et al. (1988, ApJ, 328, 315) | -5 deg to +60 deg | 320-810 nm | 5 nm |
| Massey & Cornwall (1990, ApJ, 358, 344) | -5 deg to +54 deg | 735-1020 nm | 5 nm |
| Hamuy et al. (1994, PASP, 106, 566) | -68 deg to +11 deg | 330-1030 nm | 5 nm |
| Bessell (1999, PASP, 111, 1426) | EG 131* | 330-1030 nm | 5 nm |
*Note that the calibration files for EG 131 are distributed with the Gemini IRAF package in the directory gmos$calib/.
Previous versions: August 28, 2003: Kathy Roth; February 22, 2002: Inger Jørgensen
Lick Standards
The following Lick secondary standard stars (Worthey et al. 1994) have been observed and the reduced data is available using the links below. The data reduction and Lick calibration are described in Puzia et al. (2013). These data are useful as templates, radial velocity standands, as well as calibrating GMOS to the Lick spectral index system. Note: "response calibrated" implies that the instrument spectral response calibration has been applied, the spectra do not have an absolute flux calibration.
- GMOS-N, B600_G5303, 0.75 arcsec slit: response calibrated, uncalibrated
- GMOS-N, B600_G5303, 0.50 arcsec slit: response calibrated, uncalibrated
- GMOS-S, B600_G5323, 0.50 arcsec slit: response calibrated, uncalibrated
| Star | Type | Program ID | Slit width | Binning | Grating | Wavelengths [nm] |
Comment |
| HD074377 | K3V C | GN-2002A-Q-17 | 0.75 arcsec | 2x2 | B600_G5303 | 508,510 | |
| HD148816 | F8V C | GN-2002A-Q-17 | 0.75 arcsec | 2x2 | B600_G5303 | 508,510 | |
| HD165195 | G5IV | GN-2002A-Q-17 | 0.75 arcsec | 2x2 | B600_G5303 | 508,510 | |
| HD172401 | K0III D | GN-2002A-Q-17 | 0.75 arcsec | 2x2 | B600_G5303 | 508,510 | |
| HD172958 | B8V | GN-2002A-Q-17 | 0.75 arcsec | 2x2 | B600_G5303 | 508,510 | |
| HD199580 | K0III-IV C | GN-2002A-Q-17 | 0.75 arcsec | 2x2 | B600_G5303 | 508,510 | |
| HD017709 | K5III C | GN-2002B-Q-77 | 0.5 arcsec | 1x1 | B600_G5303 | 508,510 | |
| HD019373 | G0V C | GN-2002B-Q-77 | 0.5 arcsec | 1x1 | B600_G5303 | 508,510 | |
| HD020893 | K5III C | GN-2002B-Q-77 | 0.5 arcsec | 1x1 | B600_G5303 | 508,510 | |
| HD034411 | G1.5IV-V C | GN-2002B-Q-77 | 0.5 arcsec | 1x1 | B600_G5303 | 508,510 | |
| HD097907 | K3III C | GN-2003A-Q-75 | 0.5 arcsec | 1x1 | B600_G5303 | 508,510 | |
| HD143761 | G0Va C | GN-2003A-Q-75 | 0.5 arcsec | 1x1 | B600_G5303 | 508,510 | |
| HD147677 | K0III C | GN-2003A-Q-75 | 0.5 arcsec | 1x1 | B600_G5303 | 508,510 | |
| HD161817 | sdA2VI C | GN-2004A-Q-94 | 0.5 arcsec | 1x1 | B600_G5303 | 508,510 | |
| HD168720 | M0III C | GN-2004A-Q-94 | 0.5 arcsec | 1x1 | B600_G5303 | 508,510 | |
| HD172401 | K0III D | GN-2003A-Q-75 | 0.5 arcsec | 1x1 | B600_G5303 | 508,510 | |
| HD224930 | G5Vb C | GN-2002B-Q-77 | 0.5 arcsec | 1x1 | B600_G5303 | 508,510 | |
| HD036003 | K5V D | GS-2003B-Q-63 | 0.5 arcsec | 1x1 | B600_G5323 | 508,510 | |
| HD037160 | K0IIIb C | GS-2003B-Q-63 | 0.5 arcsec | 1x1 | B600_G5323 | 508,510 | |
| HD043318 | F6V D | GS-2003B-Q-63 | 0.5 arcsec | 1x1 | B600_G5323 | 508,510 | |
| HD049161 | K4III C | GS-2003B-Q-63 | 0.5 arcsec | 1x1 | B600_G5323 | 508,510 | |
| HD064606 | G8V C | GS-2003B-Q-63 | 0.5 arcsec | 1x1 | B600_G5323 | 508,510 | |
| HD069267 | K4III C | GS-2003B-Q-63 | 0.5 arcsec | 1x1 | B600_G5323 | 508,510 | |
| HD145148 | K1.5IV C | GS-2004A-Q-62 | 0.5 arcsec | 1x1 | B600_G5323 | 508,510 | |
| HD165760 | G8III C | GS-2004A-Q-62 | 0.5 arcsec | 1x1 | B600_G5323 | 508,510 | |
| HD175638 | A5V C | GS-2003B-Q-63 | 0.5 arcsec | 1x1 | B600_G5323 | 508,510 | |
| HD184406 | K3IIIb C | GS-2003B-Q-63 | 0.5 arcsec | 1x1 | B600_G5323 | 508,510 | |
| HD184492 | G8IIIa C | GS-2003B-Q-63 | 0.5 arcsec | 1x1 | B600_G5323 | 508,510 | |
| HD200779 | K6V | GS-2003B-Q-63 | 0.5 arcsec | 1x1 | B600_G5323 | 508,510 | |
| HD207076 | M8IIIv C | GS-2003B-Q-63 | 0.5 arcsec | 1x1 | B600_G5323 | 508,510 | |
| HD219617 | F8IV C | GS-2003B-Q-63 | 0.5 arcsec | 1x1 | B600_G5323 | 508,510 |
Examples of Calibration Data
- Plots of CuAr spectra to assist with wavelength calibration
- Imaging flat fields for GMOS-N and GMOS-S
- Bias images for GMOS-N and GMOS-S
The GMOS-N DD E2V detectors, which were in operation until February 2017, and the new GMOS-N and GMOS-S Hamamatsu detectors exhibit much less fringing than the original EEV detectors. See fringing for examples.
CuAr spectra
Wavelength calibration of GMOS spectra is usually based on CuAr spectra. This page provides plots of CuAr spectra obtained with GMOS. The raw data from GMOS has long wavelengths (red) to the left and short wavelengths (blue) to the right. The spectra shown here have been calibrated and therefore have short wavelengths to the left and long wavelengths to the right.
The CuAr linelist supplied with the standard IRAF distribution will provide good wavelength calibrations. A custom CuAr linelist is also distributed with the Gemini IRAF package. A linelist including 2nd order CuAr lines, which may be useful for calibrating red wavelength settings (>~ 850 nm), can be found here (so far tested for some R400 grating configurations).
Grating B600, central wavelength 600nm, no filter. PostScript version of the plot
Grating B600, central wavelength 430nm, no filter. PostScript version of the plot
Grating R400, central wavelength 780nm, no filter. PostScript version of the plot
Flat field images
GMOS-N flat fields (Hamamatsu)
An example flat taken with the GMOS-N Hamamatsu detector array (installed in February/March 2017) is shown below. There is currently less dust visible in the field than with the previous arrays, and there is no longer a "dust bunny" feature. The image below highlights a number of features characteristic of the Hamamatsu array:
i) "Scalloping" (result of the CCD manufacturing process): The "scalloping" features close to the edges of the chips are stationary, so that they can be removed from science data by the flat field correction.
ii) Bright lines at the borders of the chips: Due to these lines, the effective inter-chip region, not usable for science, is larger than the physical size of the chip gaps. Recommendations for the spatial or spectral dither sizes that are needed to achieve a full coverage of the inter-chip region (including the area affected by the bright lines) are listed under "Observing Strategies" for the respective observing mode.
iii) "Ragged line" feature (also known as "Manhattan skyline") of yet unknown origin: The "ragged line" feature extends over the very top part of the three chips. This is a series of darker columns (~2% lower than the background) that span the full set of 3 CCDs. The feature moves downward on the array with successive abort cycles, but can be brought back to the top of the array by initializing the detector controller. It is possible that this feature may therefore be brought down during the night towards the center of the array if exposures are aborted. Since it may not be noticed by the observer or it may not be possible to do the DC intiialzing (which affects the bias level for a period of time afterwards), users may want to use a combination of dithered exposures for their science. If it shows up in the twilght flatfield exposures that are being used (at the same location and away from the top of the detector), you should grab twilght flats from additional nights. As of August 19, 2020, standard procedure at GN is to perform daytime DC initializations after any nighttime aborts.
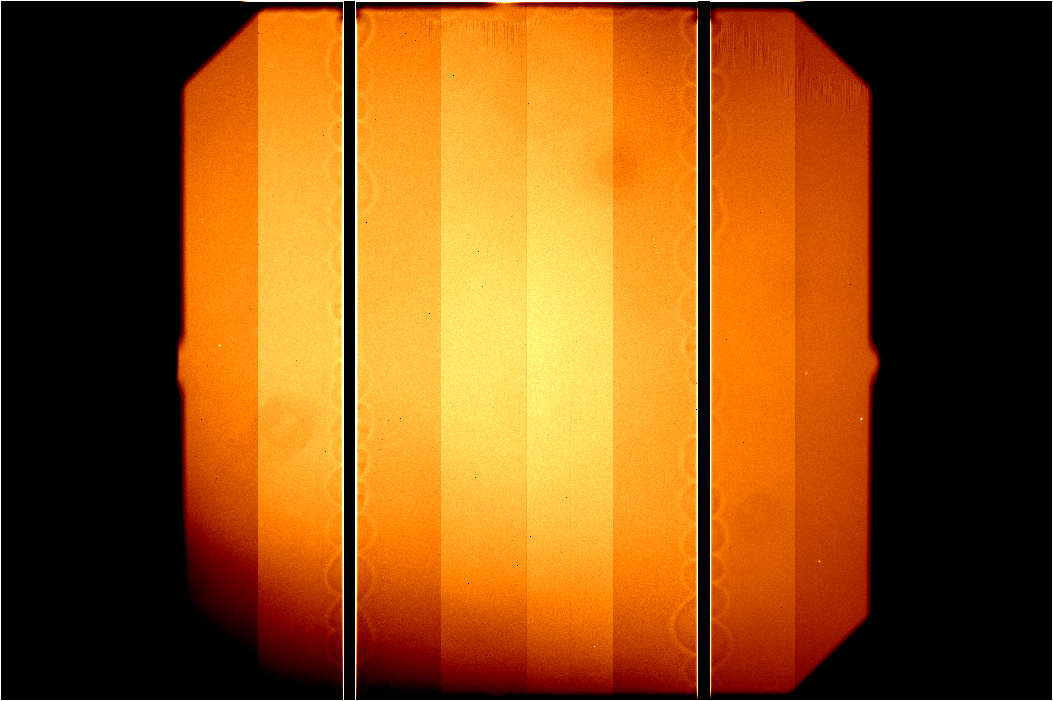
Single GMOS-N twilight flat frame taken with the Hamamatsu detector array through the r'-fitler in 2x2 binning and slow/low readout mode. The 12 amplifiers have been mosaiced without any bias subtraction. "Scalloping" can be seen as the circular patterns close to the chip edges. The "ragged line" feature is obvous at the top of the illuminated filed. (See text for further details.)
iv) Note that the flat shown above exhibits an attenuation in the bottom part of the field (in this case most prominently in the bottom left corner). This is due to the long-standing issue with air bubbles in the index-matching oil in the GMOS lens interfaces. The lens interfaces in GMOS-N were thoroughly refilled during the August 2019 telescope shutdown which has significantly improved the flat fielding performance in the area previously affected by the air bubbles. Users are advised to not mix science data taken after August 29, 2019 with flats taken before that date and vice versa.
GMOS-N flat fields (EEV)
Example imaging flat fields for GMOS-N with the red EEV CCDs are shown below. The flats are normalized and have been displayed with a greyscale from 0.8 to 1.2.
Additional information about a flat field feature that appeared in 2006 is provided here.
 |
 |
|
g'-filter twilight flat field. |
r'-filter twilight flat field. |
 |
 |
|
i'-filter twilight flat field. |
z'-filter dome flat field. |
GMOS-S flat fields (EEV)
Example imaging flat fields for GMOS-S with the E2V CCDs are shown below. The flats are normalized. The data are from the commissioning. The g', r' and i' imaging flats are from dataset GS-CAL20030524, while the u' and z' imaging flat are from dataset GS-CAL20030717 and GS-CAL20030720.
 |
 |
|
g'-filter twilight flat field. |
r'-filter twilight flat field. |
 |
 |
|
i'-filter twilight flat field. |
z'-filter twilight flat field. |
 |
|
| u'-filter twilight flat field |
GMOS-N flatfield features introduced during August 2006 shutdown
GMOS-N was removed from the telescope July 31, 2006 as part of an extensive Gemini North shutdown period. GMOS-N was mounted on the telescope (port 5, same as previously) again on August 9. The first science data was obtained the evening of August 16 (UT August 17).
Unfortunately, at some point during this time a large flatfield feature was introduced into the GMOS-N optical path. A series of tests has determined that this feature:
- extinguishes ~2.5-3% of the incident light at the darkest point
- is present in all filters
- does not move around with either telescope position or cass rotator angle
- is located within GMOS-N somewhere downstream of the grating/mirror turret
- is not located on the detector package
- is most likely located within the GMOS-N camera
- appears to flatfield out quite well when appropriate twilight flats are used
- does not flatfield out when domeflats are used
It is very important that GMOS-N users take care to use appropriate baseline twilight flats when reducing their data: All GMOS-N data taken since and including August 17, 2006 UT should be flatfielded with twilight flats also obtained after and including August 17, 2006 UT.
Further details and images are provided below. Please note that, while we suspect that this feature arises from dust somewhere in the camera, the affectionate term "dustbunny" is not intended to imply that we actually are aware of the nature of the substance causing the new GMOS-N flatfield feature as yet.
- GMOS-N r-band and i-band 2x2 Twilight Flats showing the dustbunny
- GMOS-N r-band imaging data of an unidentified field flatfielded with improper and proper Twilight Flats
- GMOS-N i-band imaging data of an unidentified field flatfielded with improper and proper Twilight Flats
Bias Images (N and S)
Example bias images are available for the following instrument/detector combinations:
- GMOS-S Hamamatsu CCDs
- GMOS-N Hamamatsu CCDs
- GMOS-N e2v-DD interim upgrade CCDs
- GMOS-S EEV blue CCDs
- GMOS-N original EEV red CCDs
GMOS-S Hamamatsu
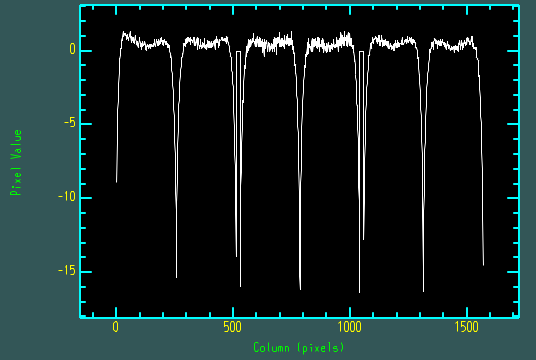
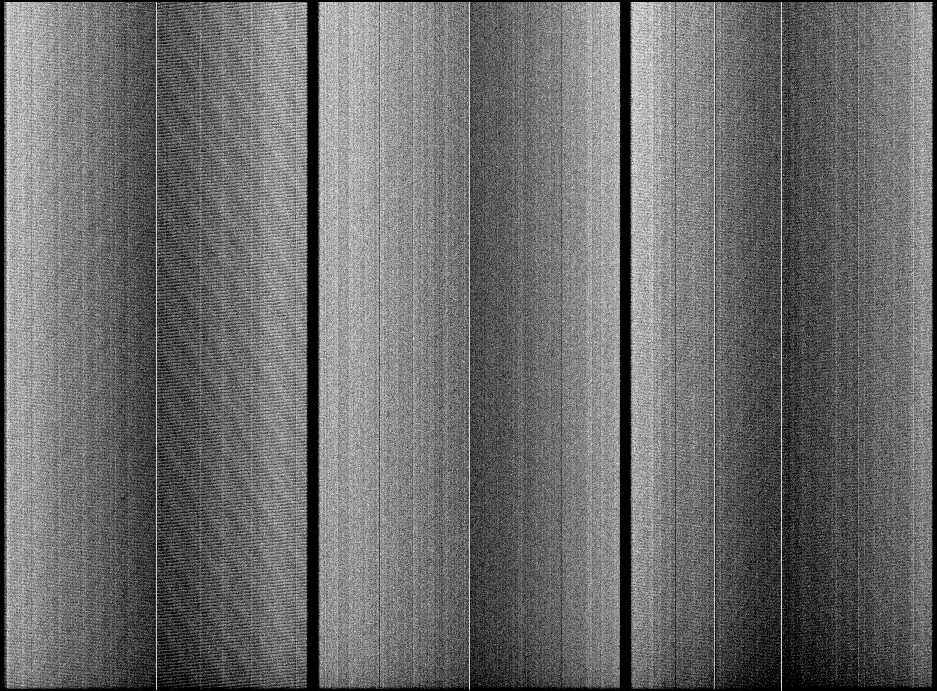
A high signal-to-noise 4x4 binned bias image for GMOS-S with the Hamamatsu CCDs is given below (overscan subtracted). These data were taken in slow read, using all twelve amplifiers. A single line plot through the bias image is also presented. As it can be seen, the bias images have some structure, in a similar way than GMOS-N CCDs has. This structure is readily visible in this high signal-to-noise example but is still present in individual bias images. There is also one bright column associated with amplifier #5.
It is recommended therefore to always create and subtract bias images from science data in order to remove the structure. In addition, overscan subtraction is recommended particularly for faint target spectroscopy as the overscan level is expected to drift with time both in absolute value and with respect to each individual amplifier. In the data presented here the average overscan levels were as follows:
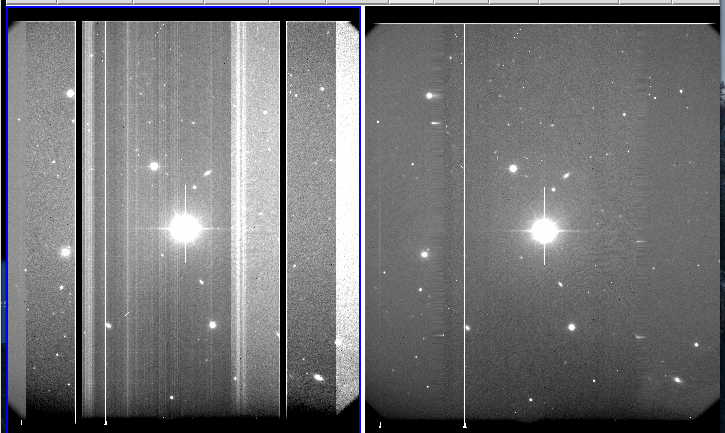
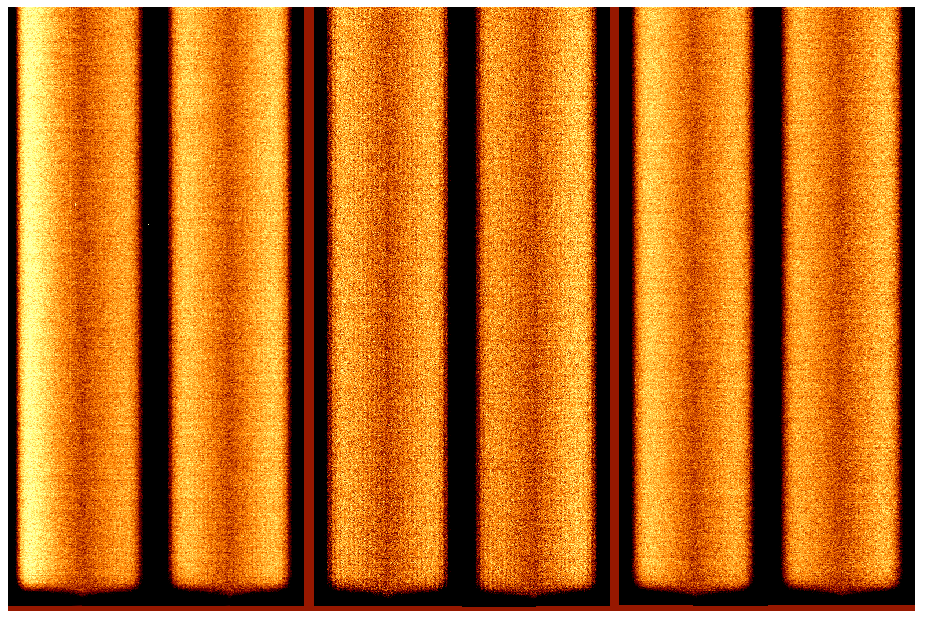
Update, October 2016:
On Friday, September 30, after a service on the GMOS-S coldhead (which requires a full thermal cycle of the dewar), new features appeared on GMOS-S raw data, the most notable features being vertical fringes on CCD2 and CCD3. These are more pronounced on CCD2 where the peak counts of these fringes now climb to ~100-400 counts above the background. For CCD3 is milder, CCD1 is the almost unaffected. Additionally there are horizontal 1-pix stripes across CCD2 and CCD3. All these features can be removed by proper bias subtraction. PIs with data taken after September 30, 2016 should make sure that they use biases taken after that date. Noise values have not changed. The snapshot below shows a raw image befor and after the bias subtraction
Current values (Hamamatsu with video boards rev. E (Septembr 1, 2015 onwards)
- extension [1]: 730
- extension [2]: 633
- extension [3]: 897
- extension [4]: 500
- extension [5]: 905
- extension [6]: 495
- extension [7]: 760
- extension [8]: 990
- extension [9]: 230
- extension [10]: 525
- extension [11]: 470
- extension [12]: 795
- extension [1]: 3316
- extension [2]: 3270
- extension [3]: 3359
- extension [4]: 3218
- extension [5]: 2985
- extension [6]: 2948
- extension [7]: 2942
- extension [8]: 3025
- extension [9]: 3084
- extension [10]: 3071
- extension [11]: 3113
- extension [12]: 3162
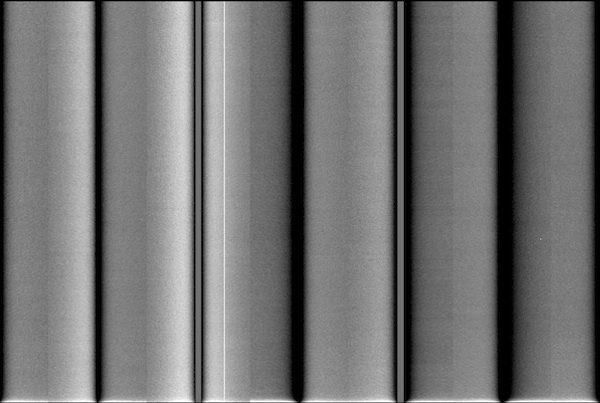
GMOS-S bias image with the Hamamatsu detectors, binned 4x4, slow readout, using all twelve amps.
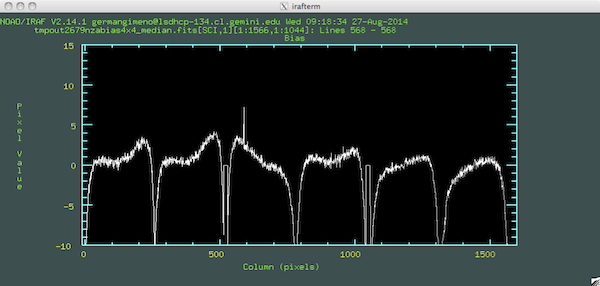
Line cut through the GMOS-S bias image above.
GMOS-N Hamamatsu
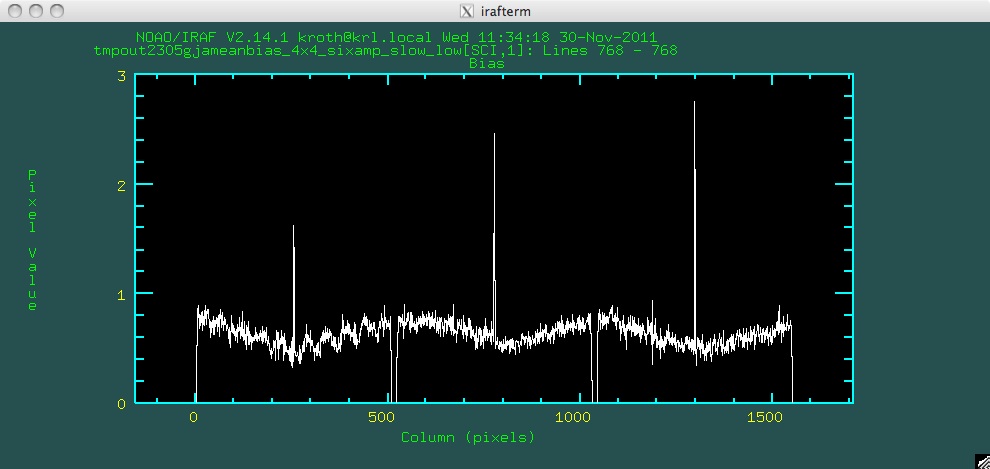
A high signal-to-noise overscan-subtracted bias image for the GMOS-N Hamamatsu CCDs is shown below. The bias was taken in 4x4 binning using the slow/low readout mode and all 12 amplifiers. Similar to the GMOS-S Hamamatsu detector array, the bias shows a spatial curvature, mainly along the detector rows. In addition to the spatial bias structure, the bias level varies with time. The implementation of a new science CCD temperature control scheme during the July/August 2017 telescope shutdown has improved the bias level stability, but residual variations are still present.
Given the spatial structure and temporal variations of the GMOS-N Hamamatsu biases, it is recommended to apply overscan and bias subtraction to all science data. Users are encouraged to create master bias frames from raw biases instead of using the precombined bias frames (*_bias.fits) from the Gemini Observatory Archive. (Since August 2017, the precombined GMOS-N biases are overscan-subtracted, which had not been the case prior to that date. However, the overscan fitting is based on a default configuration of the 'gbias' task in the Gemini GMOS IRAF package and may not provide optimal results in all cases.)
High S/N GMOS-N bias for the Hamamatsu detector array. The master bias is overscan-subtracted and based on biases taken in 4x4 binning and slow/low 12-amplifier readout
Example line cut through the GMOS-N bias image shown above.
GMOS-N e2v DD
A high signal-to-noise 4x4 binned bias image for GMOS-N with the interim upgrade e2vDD CCDs is given below. This image is composed from 1000 individual bias images, and has been overscan subtracted. These data were taken in slow read, using all six amps. A single line plot through the bias image is also presented. There are several notable features in this bias image:
- The level is not zero, as might be expected from an overscan subtracted bias image. The average bias level after overscan subtraction is on the order of 0.6 ADU.
- There is one bright column associated with every amplifier. If the amplifier is on the right side of the detector then the bright column is the furthest one to the left of the image (the last image pixel read out before the overscan). For six amp data this leads to the unfortunate result of two bright columns in the middle of each detector. The level in each column is between 1-3 ADUs. The accelerated schedule for the installation of these detectors in GMOS-N left no time to optimize the operating voltages which may have reduced or eliminated this effect.
- In addition to an overall bias level and the bright columns, the bias images have additional structure. This structure is readily visible in this high signal-to-noise example but is still present in individual bias images.
- There is evidence of high-frequency noise in four of the amps, particularly in CCD1 but at a lower level also in CCD3. The bias image for CCD2 show no evidence of this effect.
It is recommended therefore to always create and subtract bias images from science data in order to remove the features listed above. In addition, overscan subtraction is recommended particularly for faint target spectroscopy as the overscan level is expected to drift with time both in absolute value and with respect to each individual amplifier. In the data presented here the average overscan levels were as follows:
- extension [1]: 1180
- extension [2]: 1059
- extension [3]: 915
- extension [4]: 1106
- extension [5]: 1187
- extension [6]: 1105
Please remember that with this detector controller the science extensions do not correspond to the pixel data physical location in a straightforward manner. Refer to the diagram on the GMOS data format and reduction webpage for the mapping of image extension to pixel location.
GMOS-N bias image with the interim upgrade e2vDD detectors, binned 4x4, slow readout, using all six amps.
Line cut through the GMOS-N bias image above. This is a high signal-to-noise image derived from 1000 individual bias frames, the read noise on a single bias image varies by amplifier between 1.35-1.45 ADUs. Please see the GMOS-N Array (e2v DD) webpages for gain and read noise information from individual amplifiers and for the different readout modes.
GMOS-S EEV blue
An example bias image for GMOS-S with the E2V CCDs is shown below. In slow read out and using the best amplifiers the bias levels during the commissioning observations were 599 ADU/pixel, 579 ADU/pixel and 627 ADU/pixel for detector 1, 2 and 3, respectively. The greyscale used blow is chosen to show the spatial structure in the bias frame, rather than the relative levels in the three detectors. The data are from the commissioning and have been released as part of dataset GS-CAL20030524.
 |
|
Bias image: Slow read and best amplifiers. |
GMOS-N EEV red
An example bias image for GMOS-N with the original red EEV CCDs is shown below. In slow read out and using the best amplifiers the bias levels during the commissioning observations were 749 ADU/pixel, 633 ADU/pixel and 387 ADU/pixel for detector 1, 2 and 3, respectively. The greyscale used below is chosen to show the spatial structure in the bias frame, rather than the relative levels in the three detectors. The data are from the commissioning and have been released as part of dataset GN-CAL20010910.
 |
|
Bias image: Slow read and best amplifiers. |